In the framework of globalisation environment, continuing notwithstanding COVID, wars and some revival of protectionism, maybe interesting to measure the potential leadership of each country within the process. One of the best continental European University, the ETH Zurich Polytechnic, has already realised from 1970, a Globalisation Index, very structured on large data base, taking into account economic, social and political factors, and producing a classification of countries, most recently (2021 quite not changed in 2023) giving these results for the first twenty positions, on 188 analysed in total:
| Countries | Overall globalization, 2021 | Global rank | Available data |
|---|---|---|---|
| Switzerland | 91 | 1 | 1970 – 2021 |
| Belgium | 90 | 2 | 1970 – 2021 |
| Netherlands | 90 | 3 | 1970 – 2021 |
| Austria | 89 | 4 | 1970 – 2021 |
| Germany | 89 | 5 | 1970 – 2021 |
| Sweden | 89 | 6 | 1970 – 2021 |
| Denmark | 88 | 7 | 1970 – 2021 |
| UK | 88 | 8 | 1970 – 2021 |
| Finland | 87 | 9 | 1970 – 2021 |
| France | 87 | 10 | 1970 – 2021 |
| Luxembourg | 86 | 11 | 1970 – 2021 |
| Czechia | 85 | 12 | 1993 – 2021 |
| Ireland | 85 | 13 | 1970 – 2021 |
| Norway | 85 | 14 | 1970 – 2021 |
| Portugal | 85 | 15 | 1970 – 2021 |
| Spain | 85 | 16 | 1970 – 2021 |
| Canada | 84 | 17 | 1970 – 2021 |
| Greece | 84 | 18 | 1970 – 2021 |
| Hungary | 83 | 19 | 1970 – 2021 |
| Italy | 83 | 20 | 1970 – 2021 |
Very clear the positioning of small countries among the first places in globalisation process, due to their GDP quite total depending from international trade, and for this reason pivoting the process, obtaining the main advantages in terms of human development. And not only in Western Europe, like Switzerland, Austria, Scandinavians, but also in Eastern Europe, like Czechia and Hungary, with Baltics between 22 and 36. Other results are a bit surprising, because we find USA in position 29, Japan in 41, and Asiatic powers navigate in low part, with China 79, India 83. Iran is at 116 level, on total of 188 countries analysed. Of course 2021 was before wars, BRICS empowering, protectionism revivals, multipolar Kissinger model growing. But also the values of 2023 are not substantially different. So we obtain results very similar to UN Human Development Index, because the socio-cultural model of a perfect globalised country remains Euroatlantic: you must be very connected with the other countries of the planet commercially, economically and with Internet, but socially and politically the country must be compared with the Western advanced democracies and their welfare systems. The cases more evident are China and India indexes penalised by social and political factors weight, certainly not by trading and economic factors. Russia positioning is 55, so very better than Asiatic giants, because more European culture?
In order to take account of a geopolitical point of view, discussing of globalisation potential, I propose a very simple matrix, Merlinmatrix, considering only two variables, the value of export on total world trade (quantitative indicator) and geopolitical identity (qualitative indicator based on, population, language, geography, cultural heritage, military budget). So we can position in the matrix the major countries, (more than 10 million people)having the more relevant role in international trade, (more than 2% of total trade) and according an estimation of their geopolitical identity strength.
% of export on total trade value
High
| A | B |
| C | D |
A = High Export/Weak Identity – INTERNATIONALS
B = High Export/Strong Identity – GLOBAL LEADERS
C = Low Export/Weak Identity = TRIBES
D = Low Export/Strong Identity – NATIONS
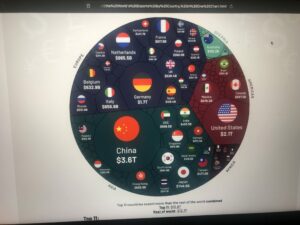
In quadrant B, Global Leader, we can position easily China (14,4%), USA (8,4%), Germany (6,8%),Japan (2,9%), France (2,4%), Russian Federation (2,1%). Total trade 2022 is around 25Trillion $.All countries having also strong Geopolitical Identity. Of course here we can consider all the small countries already in the first twenty places of Globalisation Index, having a strong Identity as small communities, but a minor relevance in international trade, very important if related to their GDP.
In quadrant A, International, we can position South Korea (3,5%), Italy (2,6%), Canada (2,3%), Mexico (2,3%). All countries having a weak Geopolitical Identity. Also EU, relevant as total export should be here if considered, because of weak identity.
In quadrant D, Nations, we can position UK, Spain, Israel, South Africa, India, Thailandia, Iran, Saudi Arabia, Brazil, Argentina,Poland, Egypt, Algeria, all countries with less than 2% quota export on total trade, but with strong National Identity.
In quadrant C, Tribes, we find all the other medium and small countries, mostly in Africa, with negligible participation to international trade and being in a process of creating their own Geopolitical Identity. The first 11 countries in international trade export more than all the others 180 or so.
It’s just an tentative idea, a proposal to better measuring the impact of commercial and economic dynamics with structural geopolitical heritage and differences, better positioning the real potential of a country versus Globalisation, not discriminating a priori the social and political aspects of every single culture. Of course a lot of energy and resources should be dedicated to understand better the next future of the world looking at economic results but also to the structural differences which only a naif approach can consider easily homogenised, as EU example demonstrates after 80 years of efforts.


